Importing from spreadsheets is under development and is not yet available to users
File types
Numerable can import data from Excel XLSX files (Open XML) and CSV (comma separated values) files.
If you have data in another format (such as XLS – Microsoft Excel 97-2003) then just open it in Excel and Save As or Export to XLSX or CSV.
When you import an XLSX file, Numerable uses only the first ‘Worksheet’ in that file.


Summary of rules for spreadsheet layout
To allow the spreadsheet to be correctly imported and displayed by Numerable:
- Each column of data should have a column header
- All column headers should be on the same row
- Each row of data should have a row header
- All rows headers should be in the far left column
- The rectangular areas containing numerical data should not have any empty cells
Three zones

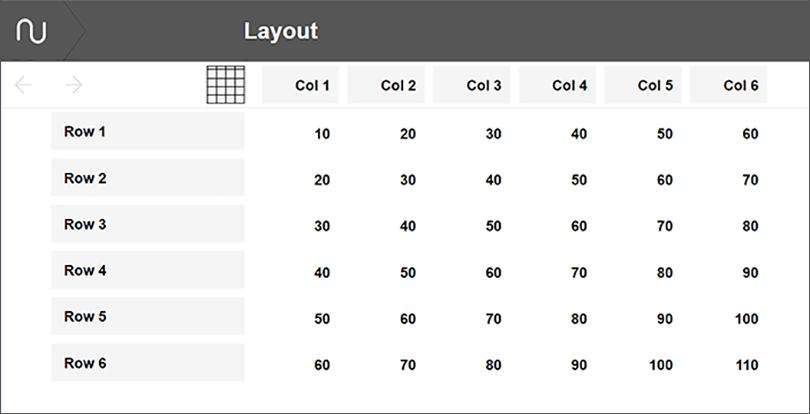
Numerable analyses your spreadsheet when it is loaded, looking for 3 zones:
- Column headers – a single row above the data; often the column headers are dates or time periods such as months, but this is not a requirement
- Row headers – a single column, to the left of the data
- Numerical data – an area, under the column headers and to the right of the row headers, with numbers in the cells
The file ‘Layout.xlsx’, shown here, is available as a Numerable demo report in the Reports Library, and can also be downloaded here.
Report titles
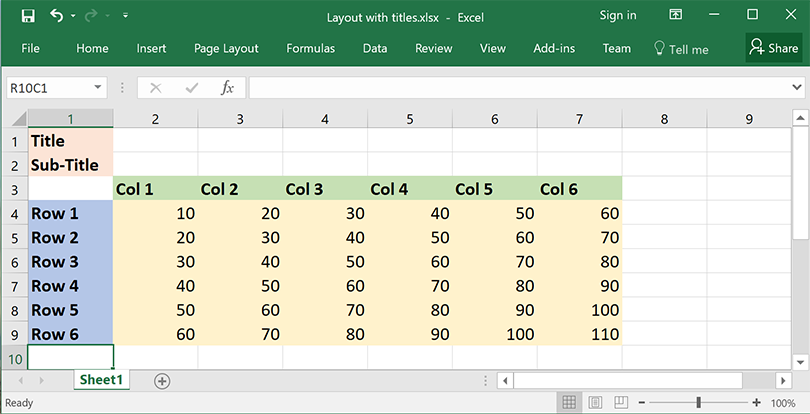
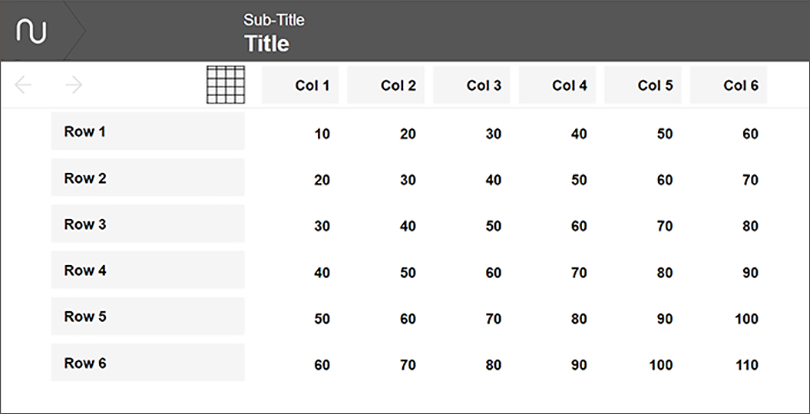
If you want you can put some single cells of text information in your spreadsheet, to act as report titles.
They should be positioned above the row of column headers.
The first cell is used as the main title in the Numerable plot.
The second is used as the sub-title – this is often the name of the organisation that the report relates to.
Groups of rows
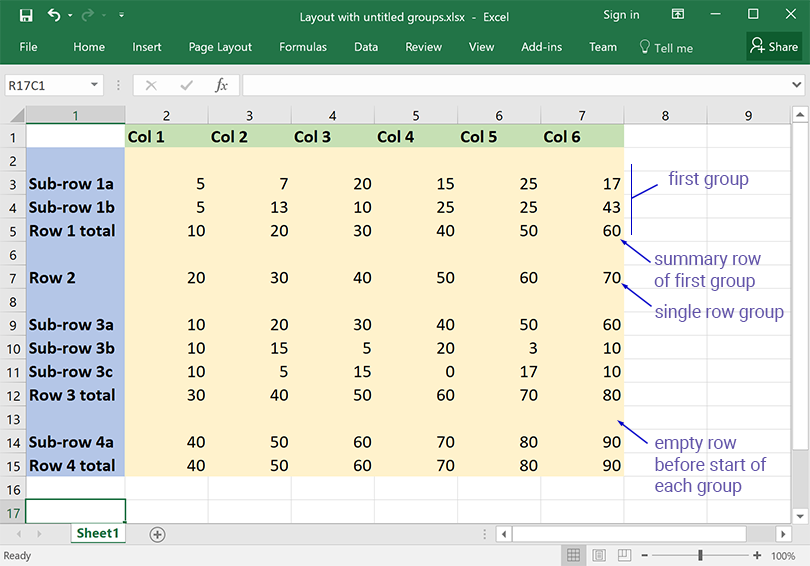
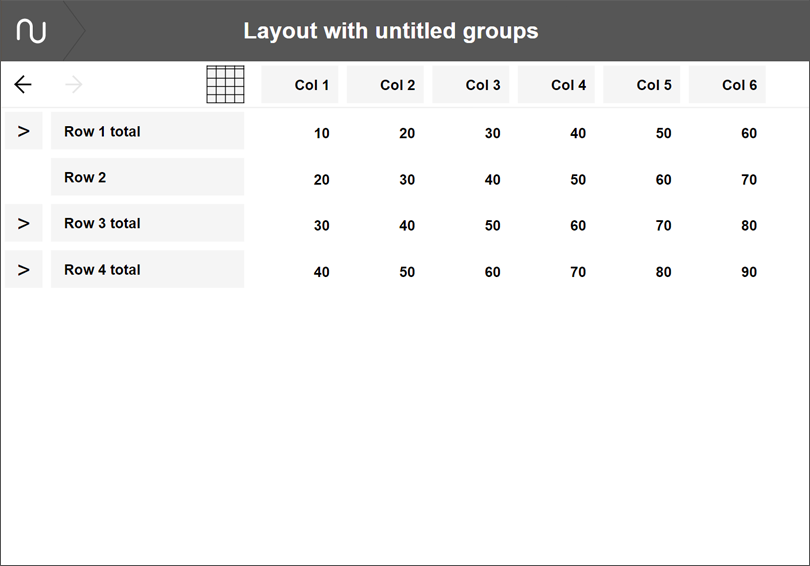
One of Numerable’s most powerful features is its ability to show a hierarchy of rows. Initially the plots show just the top level of rows in the hierarchy, but the user can click on the > button to expand a row and view its component rows (the next level down in the hierarchy).
Rows in a spreadsheet can easily be configured so that they are interpreted by Numerable as a hierarchy.
The top level row and its component sub-rows are arranged as a series of adjacent rows, with an empty row above them.
The last row in this group of rows is treated as a summary for that group (often a total value); so only that summary row is seen when the group is collapsed. Numerable does not do any calculations itself – it just shows the values in the summary row as they are read in.
Group titles
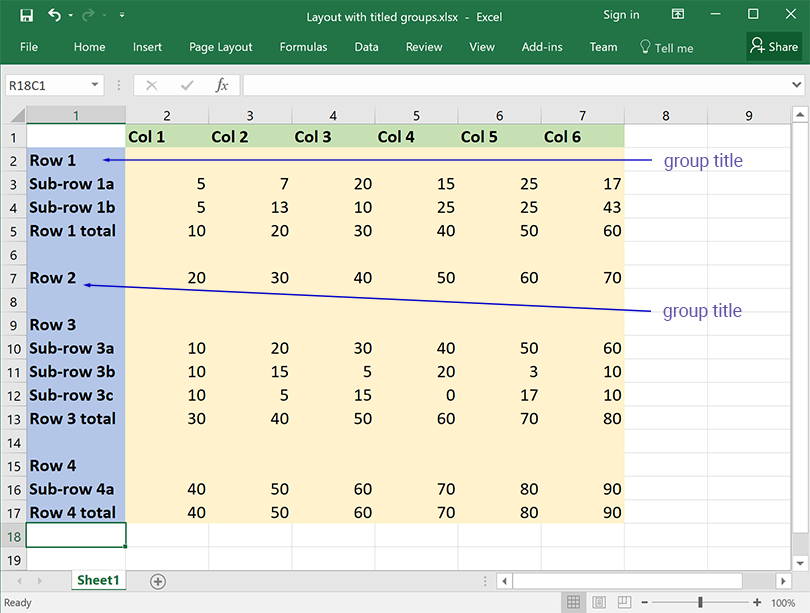
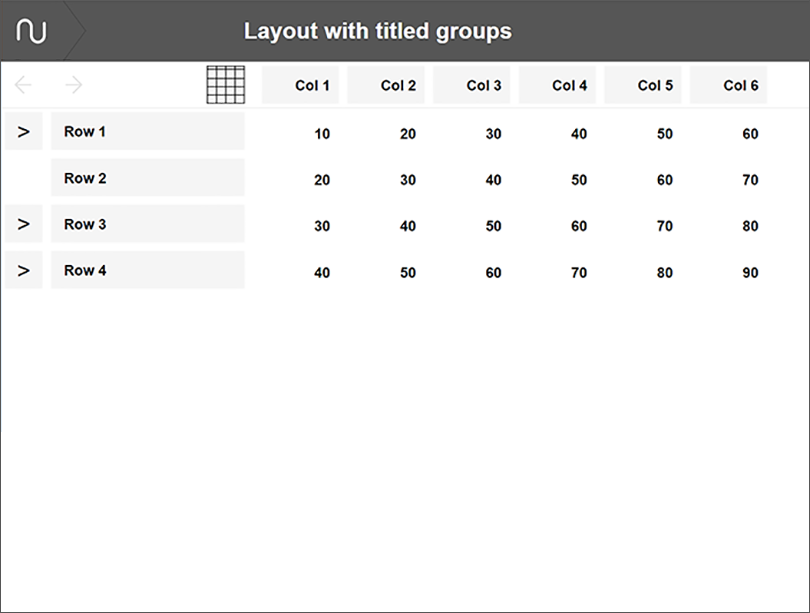
Optionally, a group of rows can have a group title, positioned in the leftmost column, immediately above the group of rows.
If a group title is supplied then Numerable uses this as the name of the group, when the group is both collapsed and expanded.
The row header is treated as the title of a single row group.
Spreadsheets exported from Xero
It is possible to export any report from Xero in Excel format.
Xero is currently introducing a new generation of reports, so many reports have 2 versions. For example there is ‘Profit and Loss’ as well as ‘Profit and Loss New’. The old reports can be exported in XLS format. The new reports, on the other hand, can be exported directly as XLSX.
We are working to enable Numerable to load these spreadsheet reports, but this is challenging due to their varying layout. Right now there are 4 reports that should load successfully. They are all old style Xero reports, so after exporting to XLS they need to be opened in Excel and re-saved as XLSX, before uploading into Numerable. The reports are:
- Profit and Loss
- Balance Sheet
- Aged Payables
- Aged Receivables
